How DeskOS works
The admin console, page by page. The same documentation your team reads inside the product, open to anyone deciding whether DeskOS fits how they run their space.
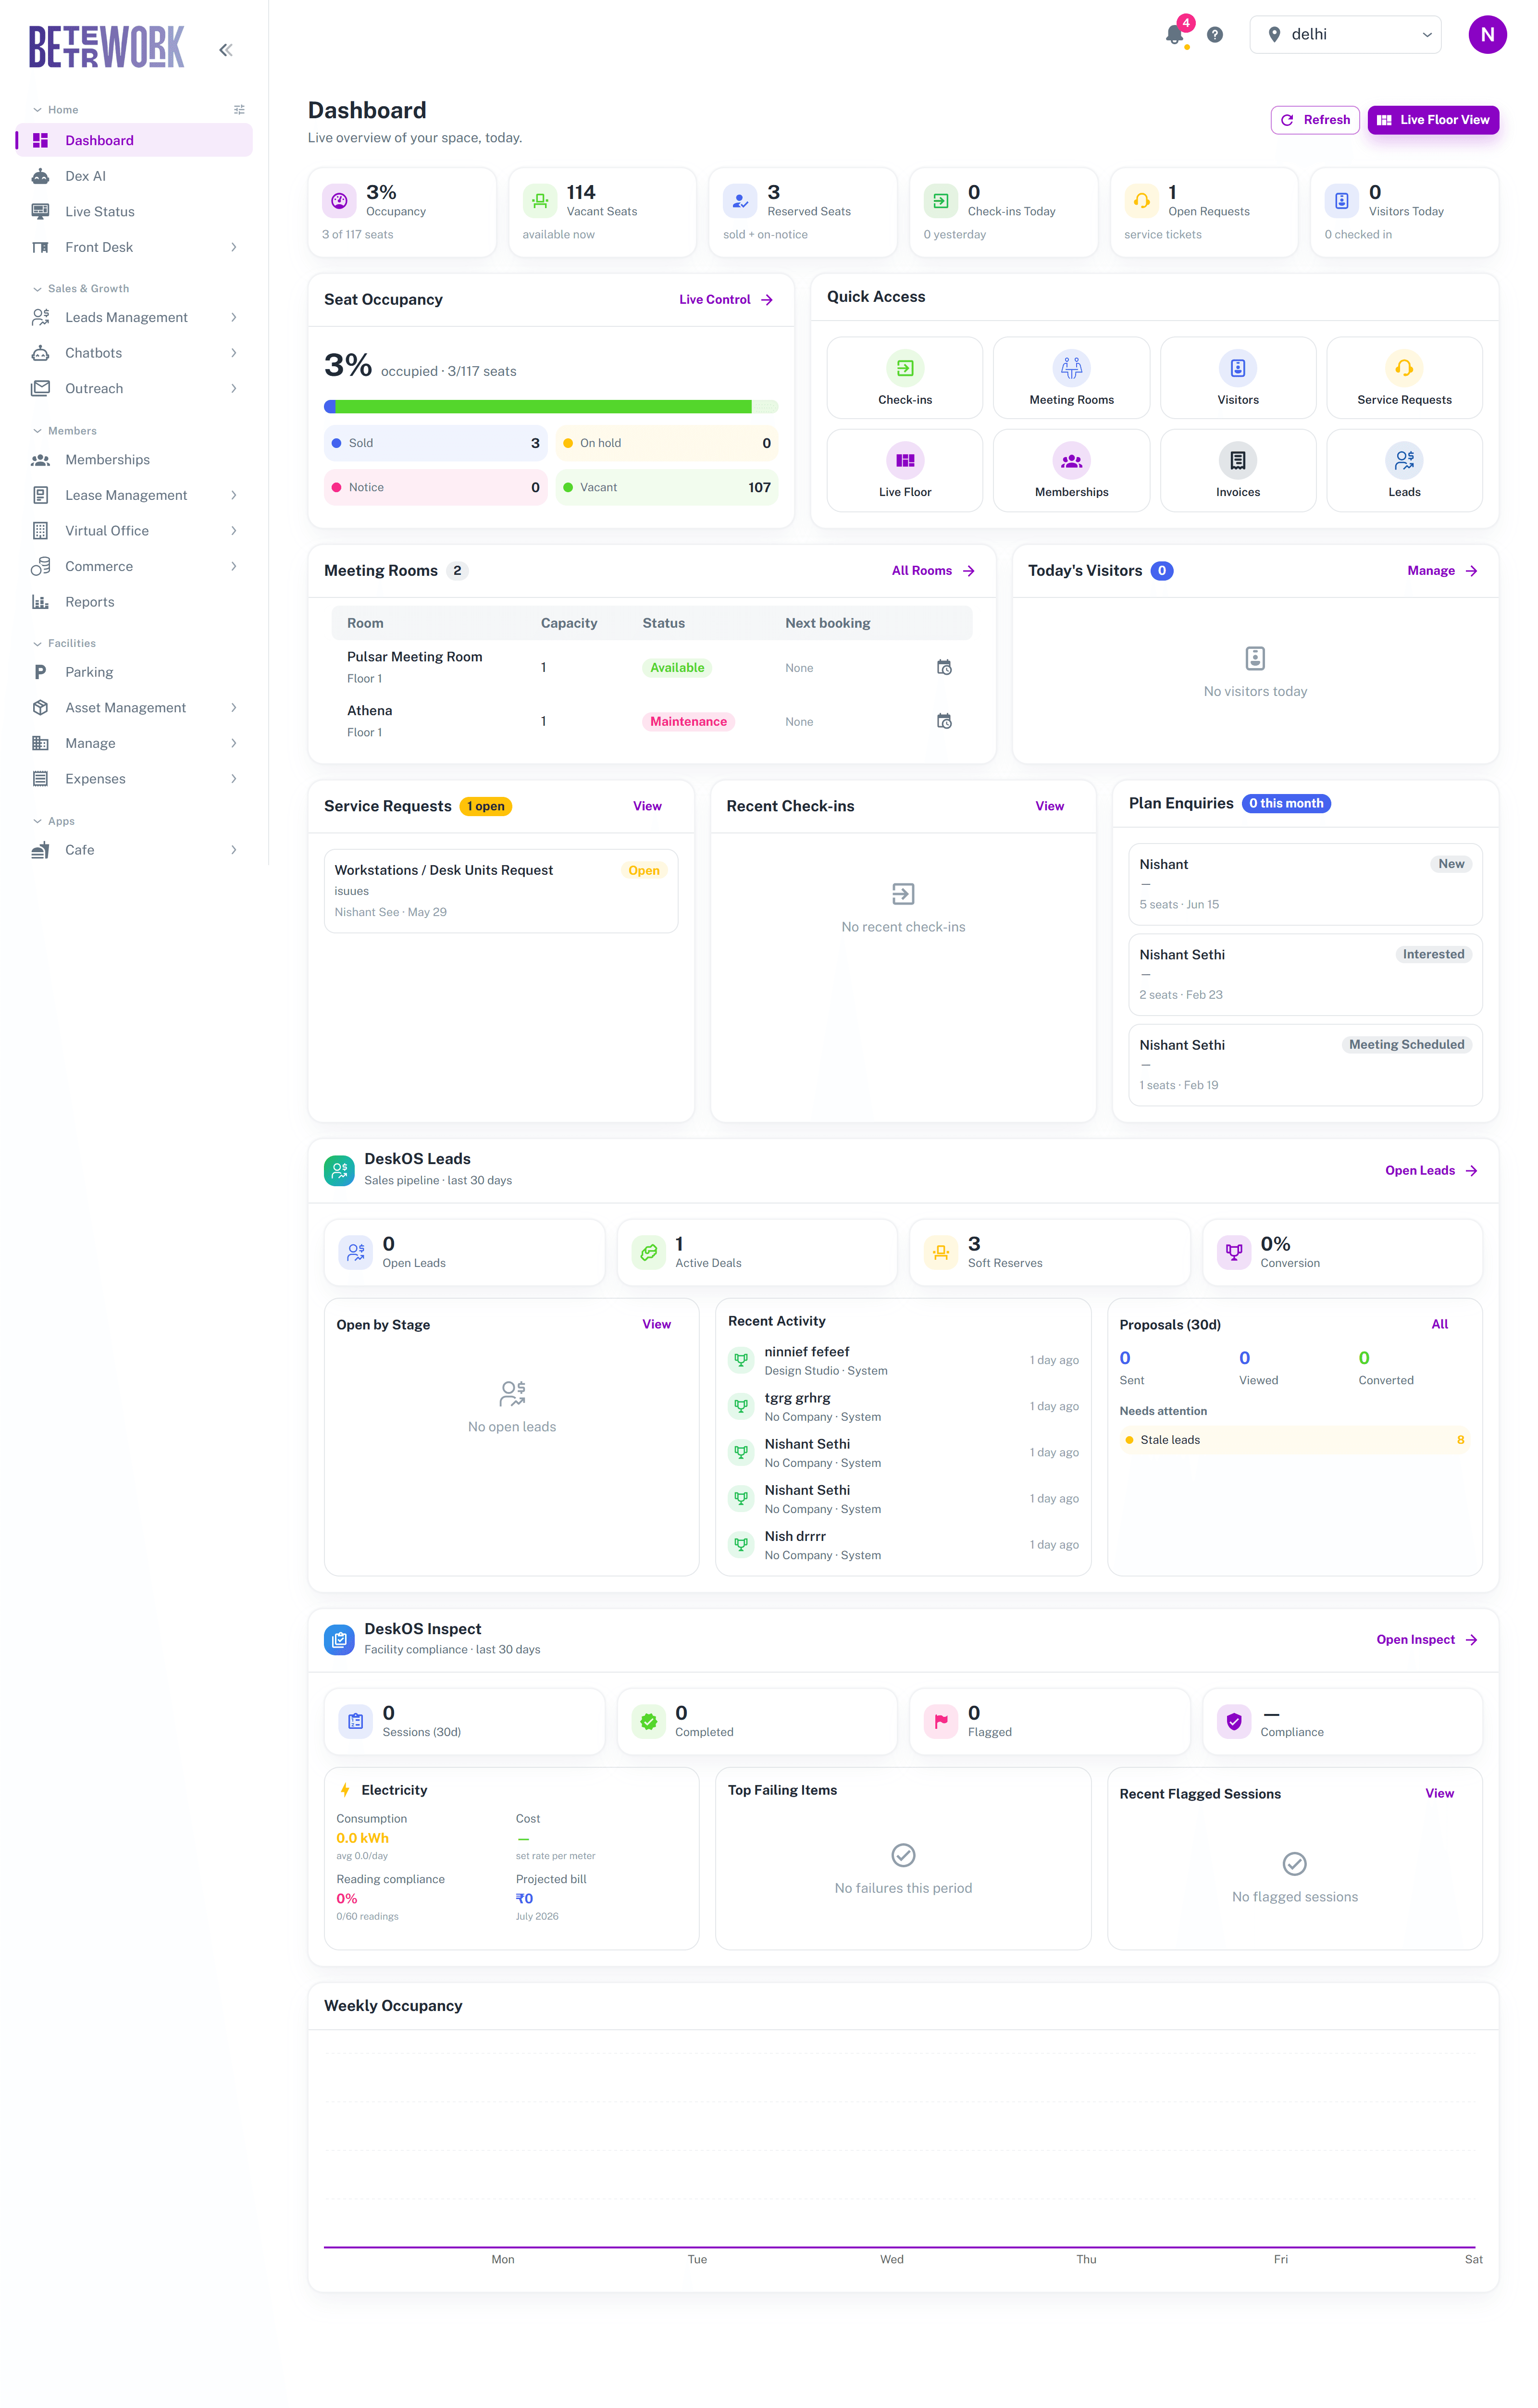
The dashboard is the first page you land on after logging in. It pulls together everything happening in your space today: how full you are, who is checking in, which service requests are open, and what your sales pipeline looks like. When something needs attention, this is usually where you will spot it first.
The stat strip
The row of tiles at the top gives you the day’s headline numbers. Most tiles are clickable and take you straight to the relevant page.
- Occupancy: the percentage of seats that are occupied right now, out of your total seat count.
- Vacant Seats: seats you can sell today. Seats on a soft hold still count as vacant, since nothing is signed yet.
- Reserved Seats: seats that are sold, including seats where the member is serving a notice period.
- Check-ins Today: member check-ins so far today, with yesterday for comparison.
- Open Requests: service tickets that are still open.
- Visitors Today: expected and checked-in visitors for the day.
Seat Occupancy
This card breaks your seats into four buckets: Sold, On hold, Notice, and Vacant. The segmented bar shows the mix, and the counts below give exact numbers. Occupancy counts seats that are sold or on notice, because a seat on notice is still paid for until the notice period ends. A soft hold is not a sale, so held seats stay in the vacant bucket.
The Live Control button on this card opens Live Status, where you can see the same numbers seat by seat on the floor plan.
Quick Access
A grid of shortcuts to the pages you open most: check-ins, meeting rooms, visitors, service requests, the live floor, memberships, invoices, and leads. Like the stat strip, it only shows the modules you have access to.
Operational cards
- Meeting Rooms: each room with its capacity, current status, and next booking. The calendar icon opens that room’s booking calendar.
- Today’s Visitors: who is expected and who has arrived, with their host.
- Service Requests: the most recent tickets and how many are open.
- Recent Check-ins: the latest member check-ins with time and location.
- Plan Enquiries: enquiries from your public plans page. Click one to see the full details and contact the person.
Module summaries
If your plan includes them, wider summary panels appear further down: DeskOS Leads shows your pipeline by stage, recent activity, and proposals from the last 30 days, and DeskOS Inspect shows facility compliance, failing checklist items, and electricity readings. Each panel has an open button that takes you into the full module.
Weekly Occupancy
The chart at the bottom plots check-ins across the week, so you can see which days your space actually gets used and plan staffing or events around it.
Still need help?
If the docs did not answer your question, our team will. Signed in customers can also raise a request from Support inside the admin console.