Coworking space analytics software where the whole company reads the same occupancy number.
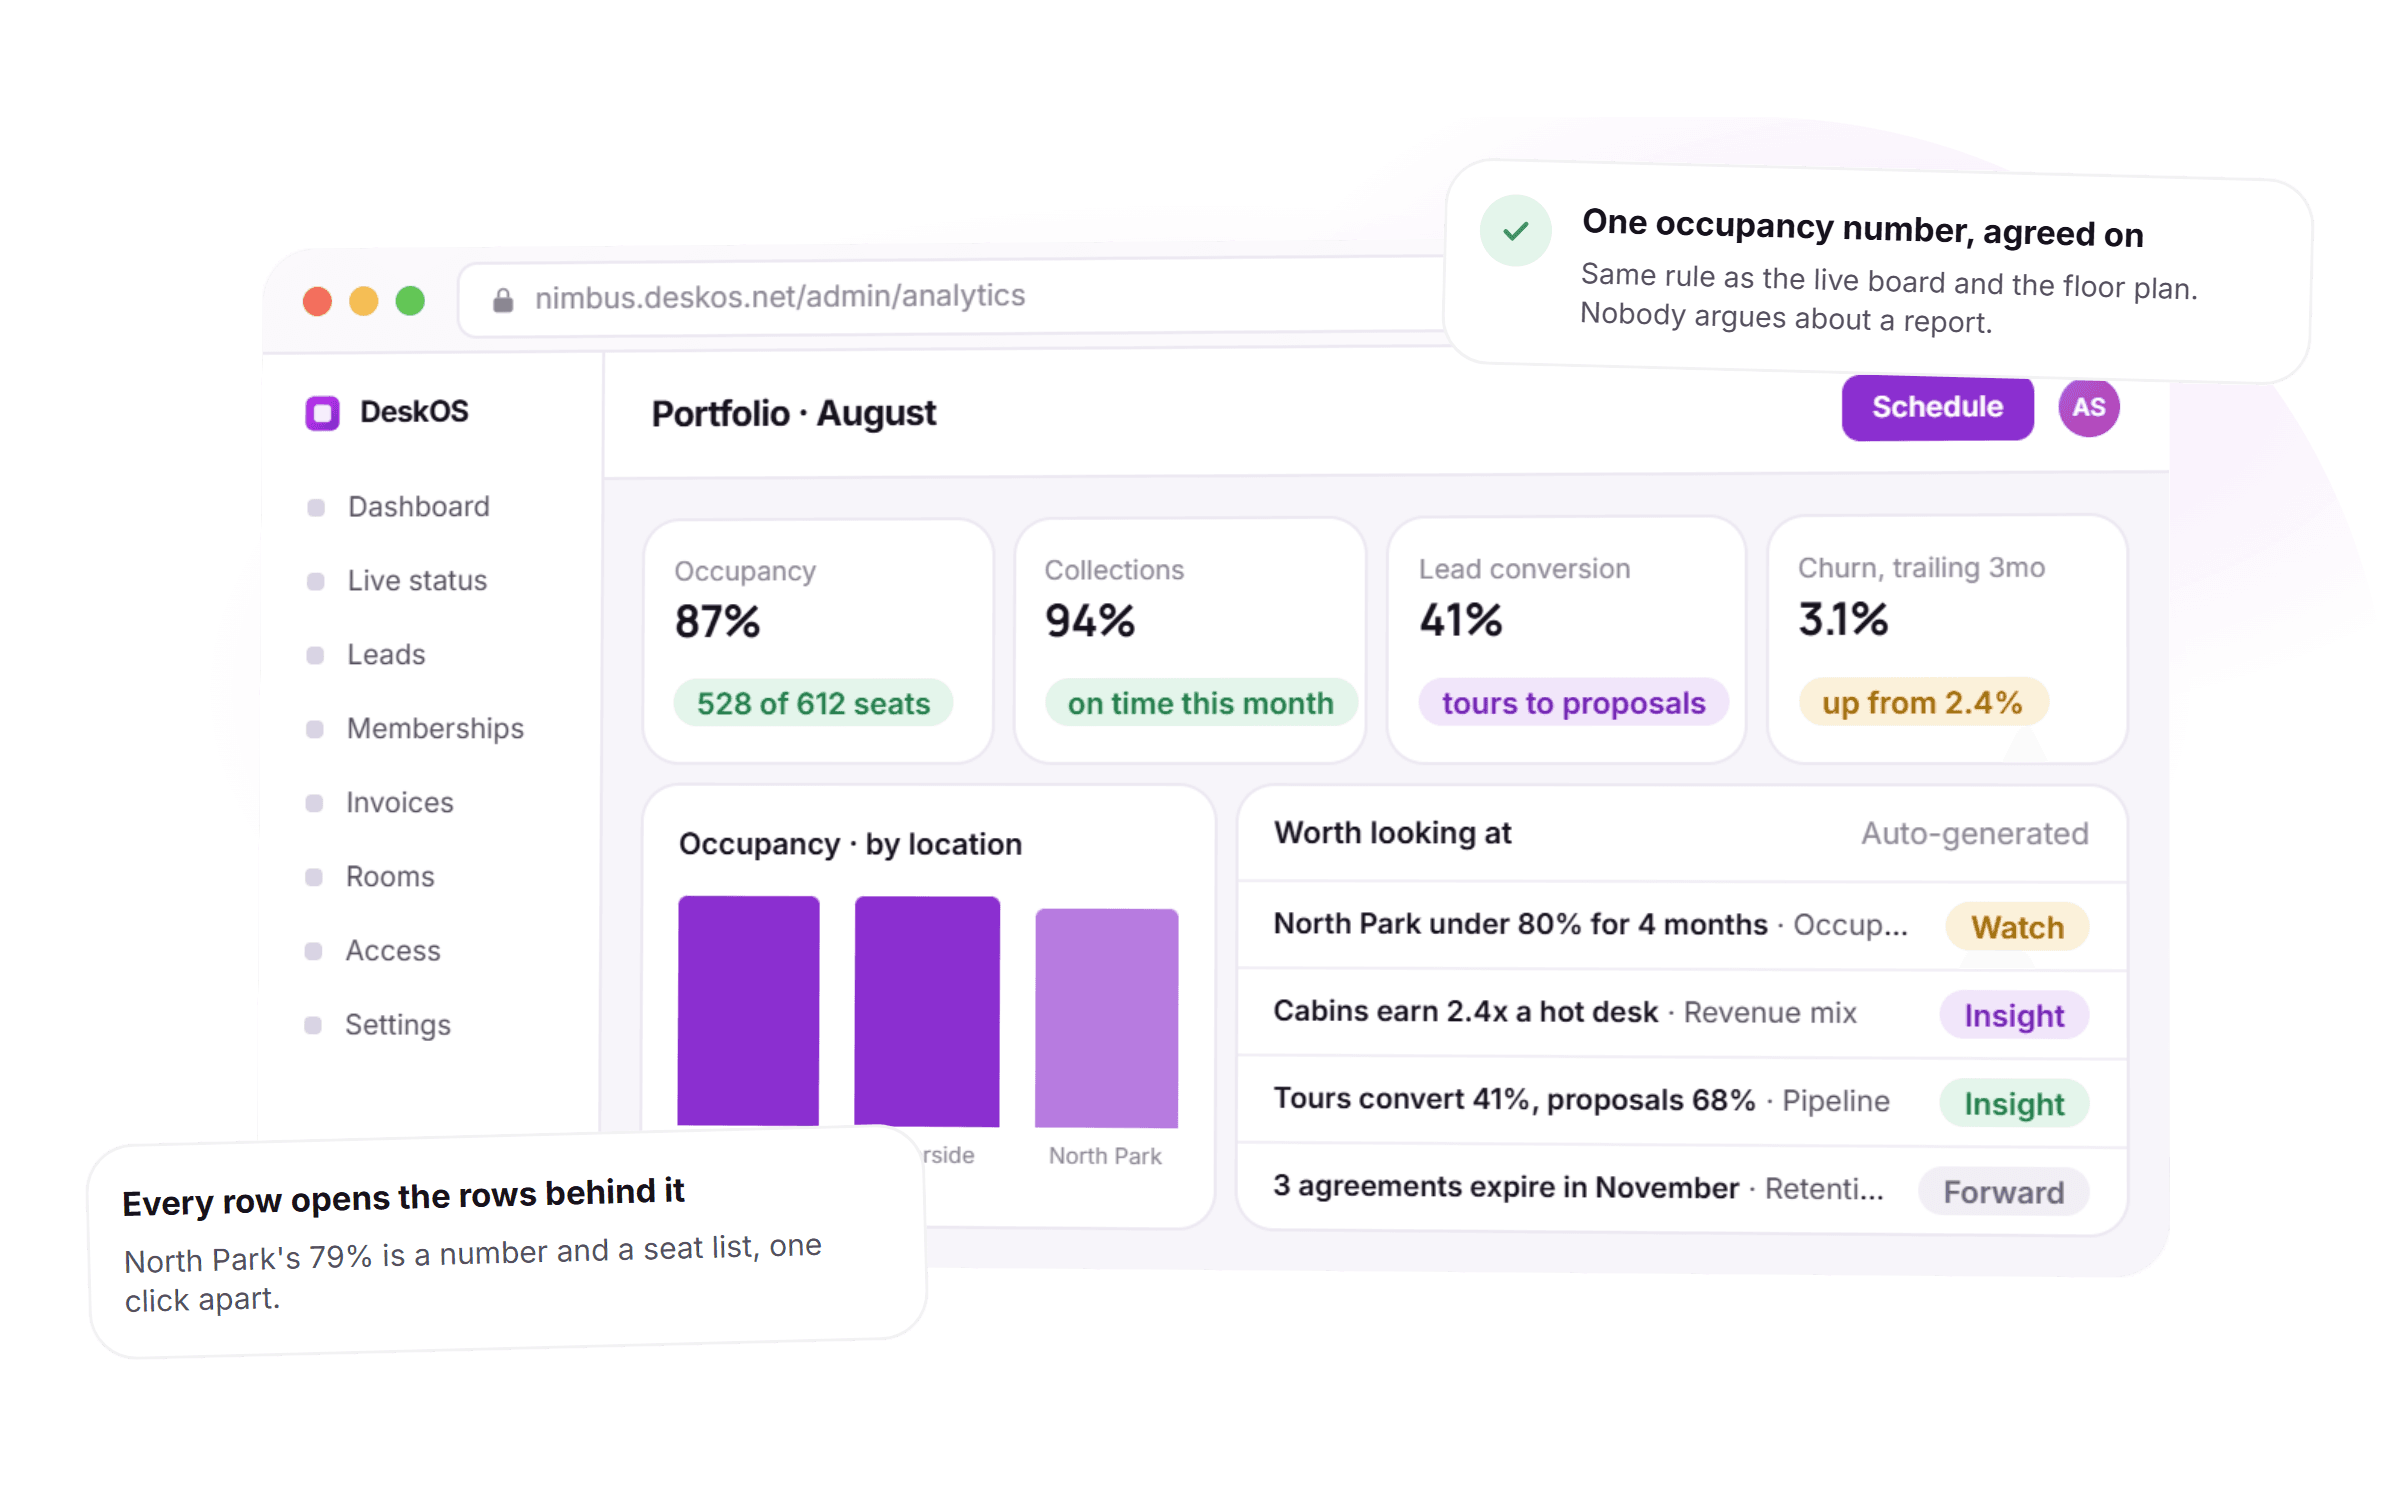
Occupancy, revenue per seat, pipeline conversion and churn, built on the same records as your billing and your seat board. No exports, no reconciliation, and one definition of occupancy applied everywhere it appears.
- Occupied means reserved plus notice, applied once, everywhere
- Revenue per seat, per plan, per location, gated by role
- Every count opens the exact rows it was built from
- Build your own view and schedule it, no SQL required
See your own occupancy and revenue numbers
A free thirty minute demo with a person, not a recording. Bring one location and a month of data and we will build your real revenue per seat before you decide anything.
Schedules to the inbox and lines up with the accounting tools you already use



The monthly report, without the three days it takes to rebuild it.
A spreadsheet somebody rebuilds by hand is out of date the moment it is sent, and half the meeting gets spent arguing about whether the occupancy number counts notice periods. Nobody trusts it enough to price on it.
- 199Reserved8Notice12HoldsOne rule, every screen
One occupancy number the whole company agrees on
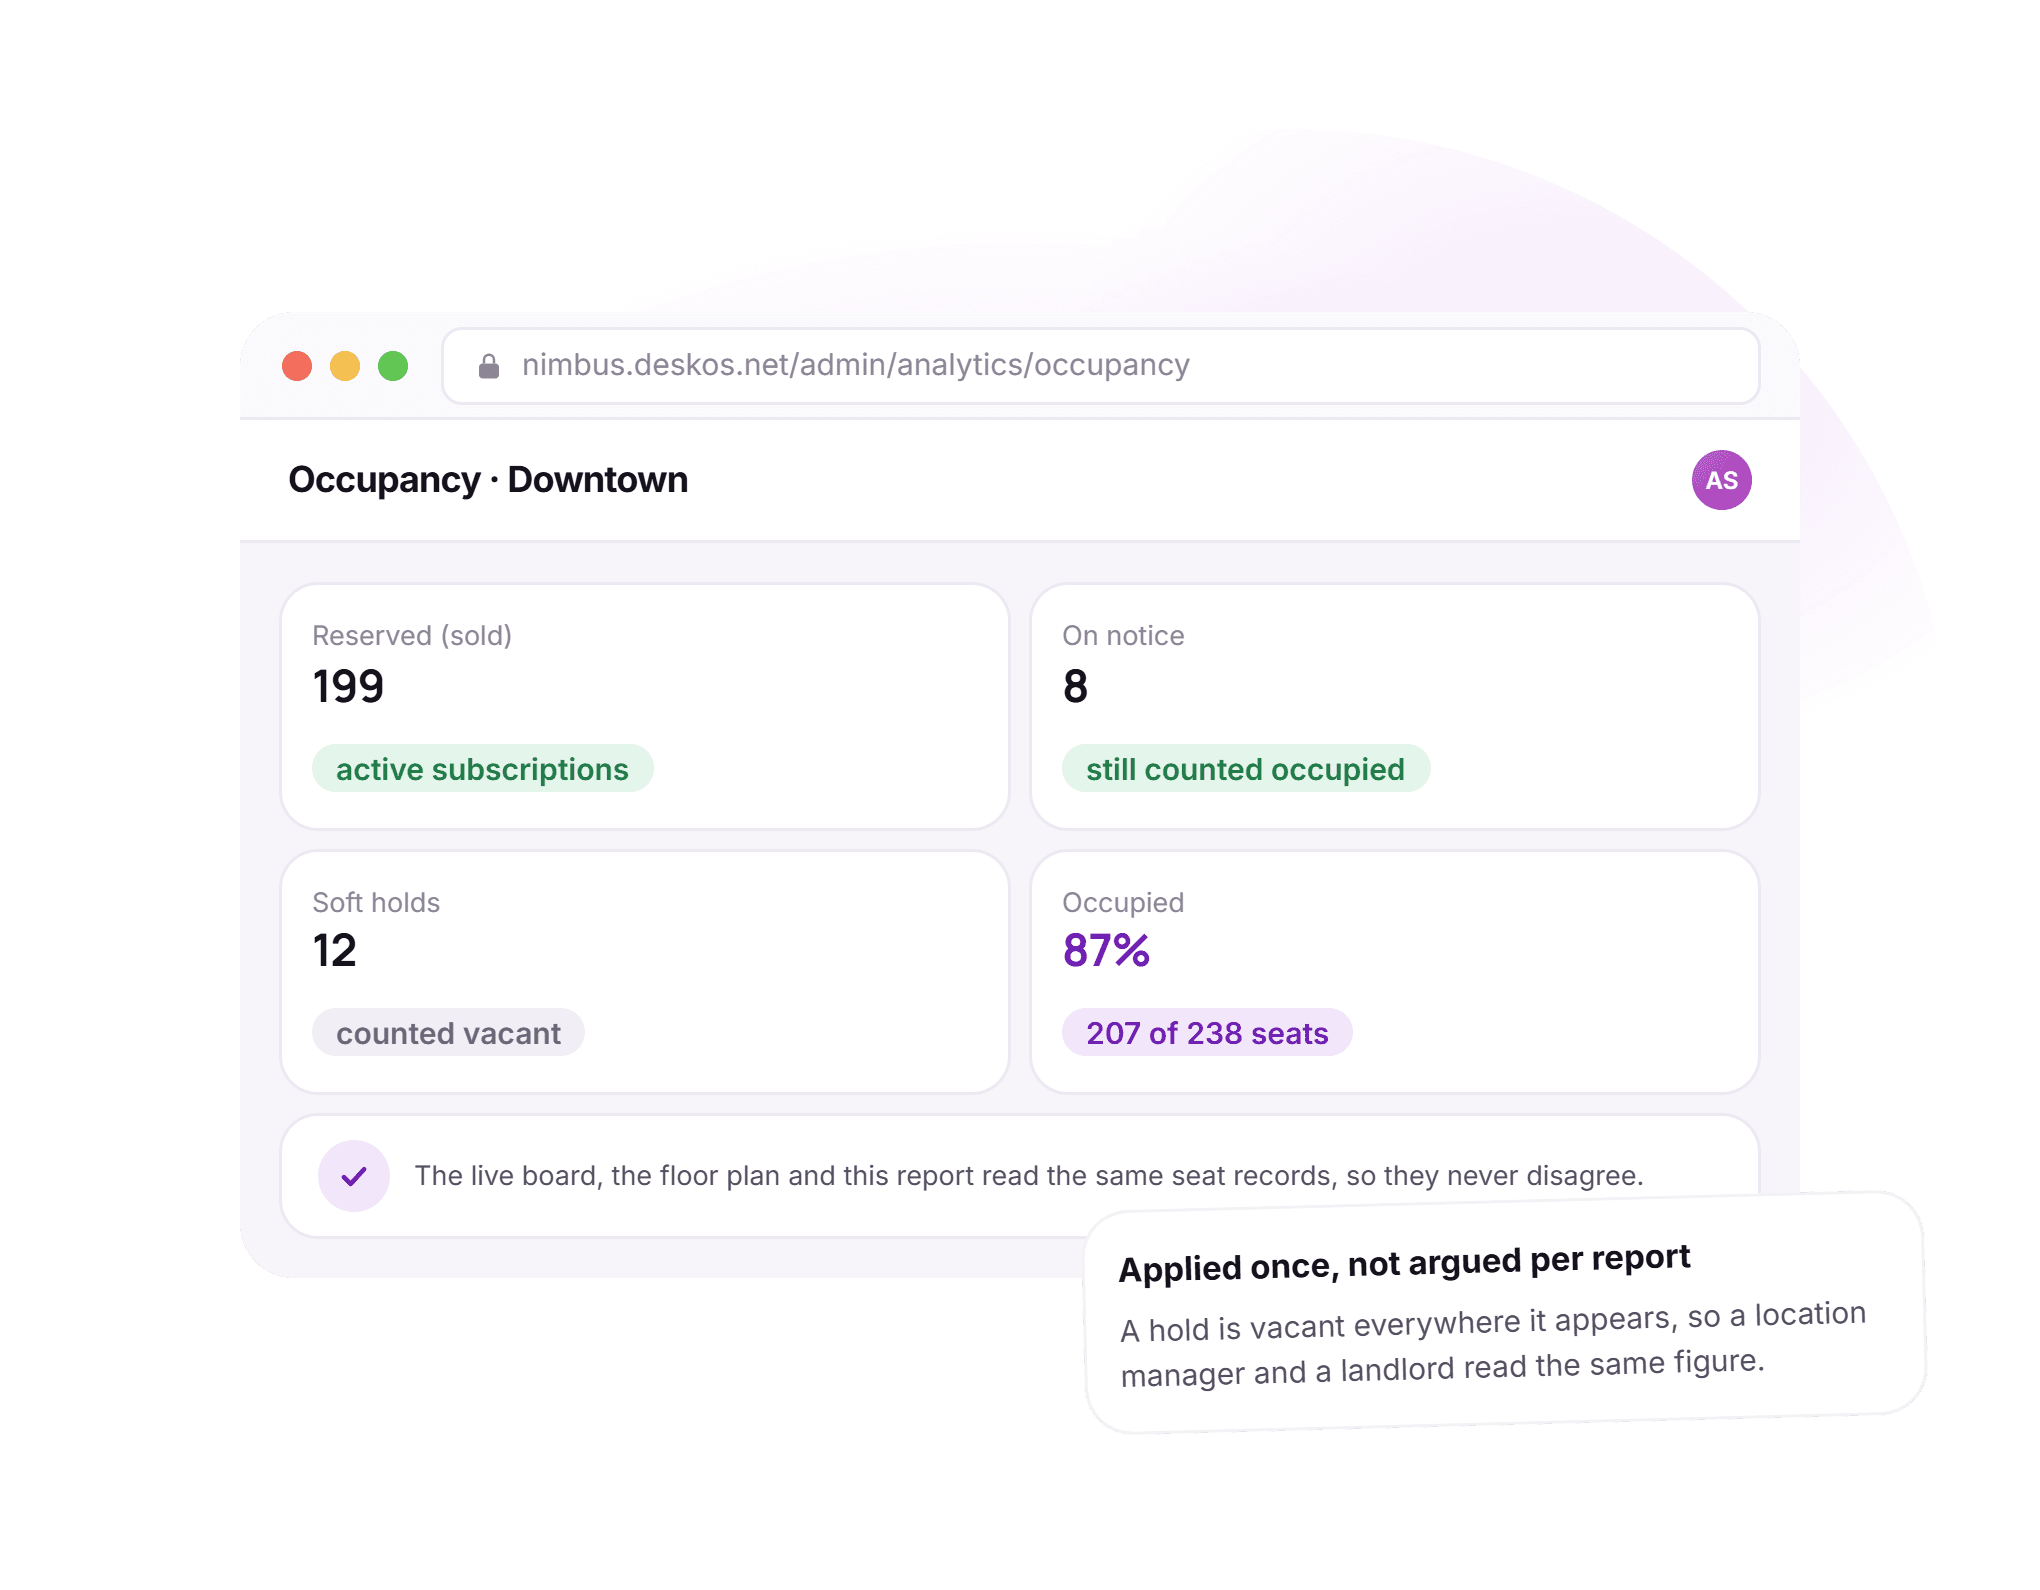
Occupied means reserved plus notice. Soft holds count as vacant. That rule is applied once in the platform rather than argued about per report, so the board pack and the floor manager see the same figure.
Where this number comes from on the seat board - Cabin seat$447Dedicated desk$298Per seat, per plan, per location
Revenue per seat, per plan, per location
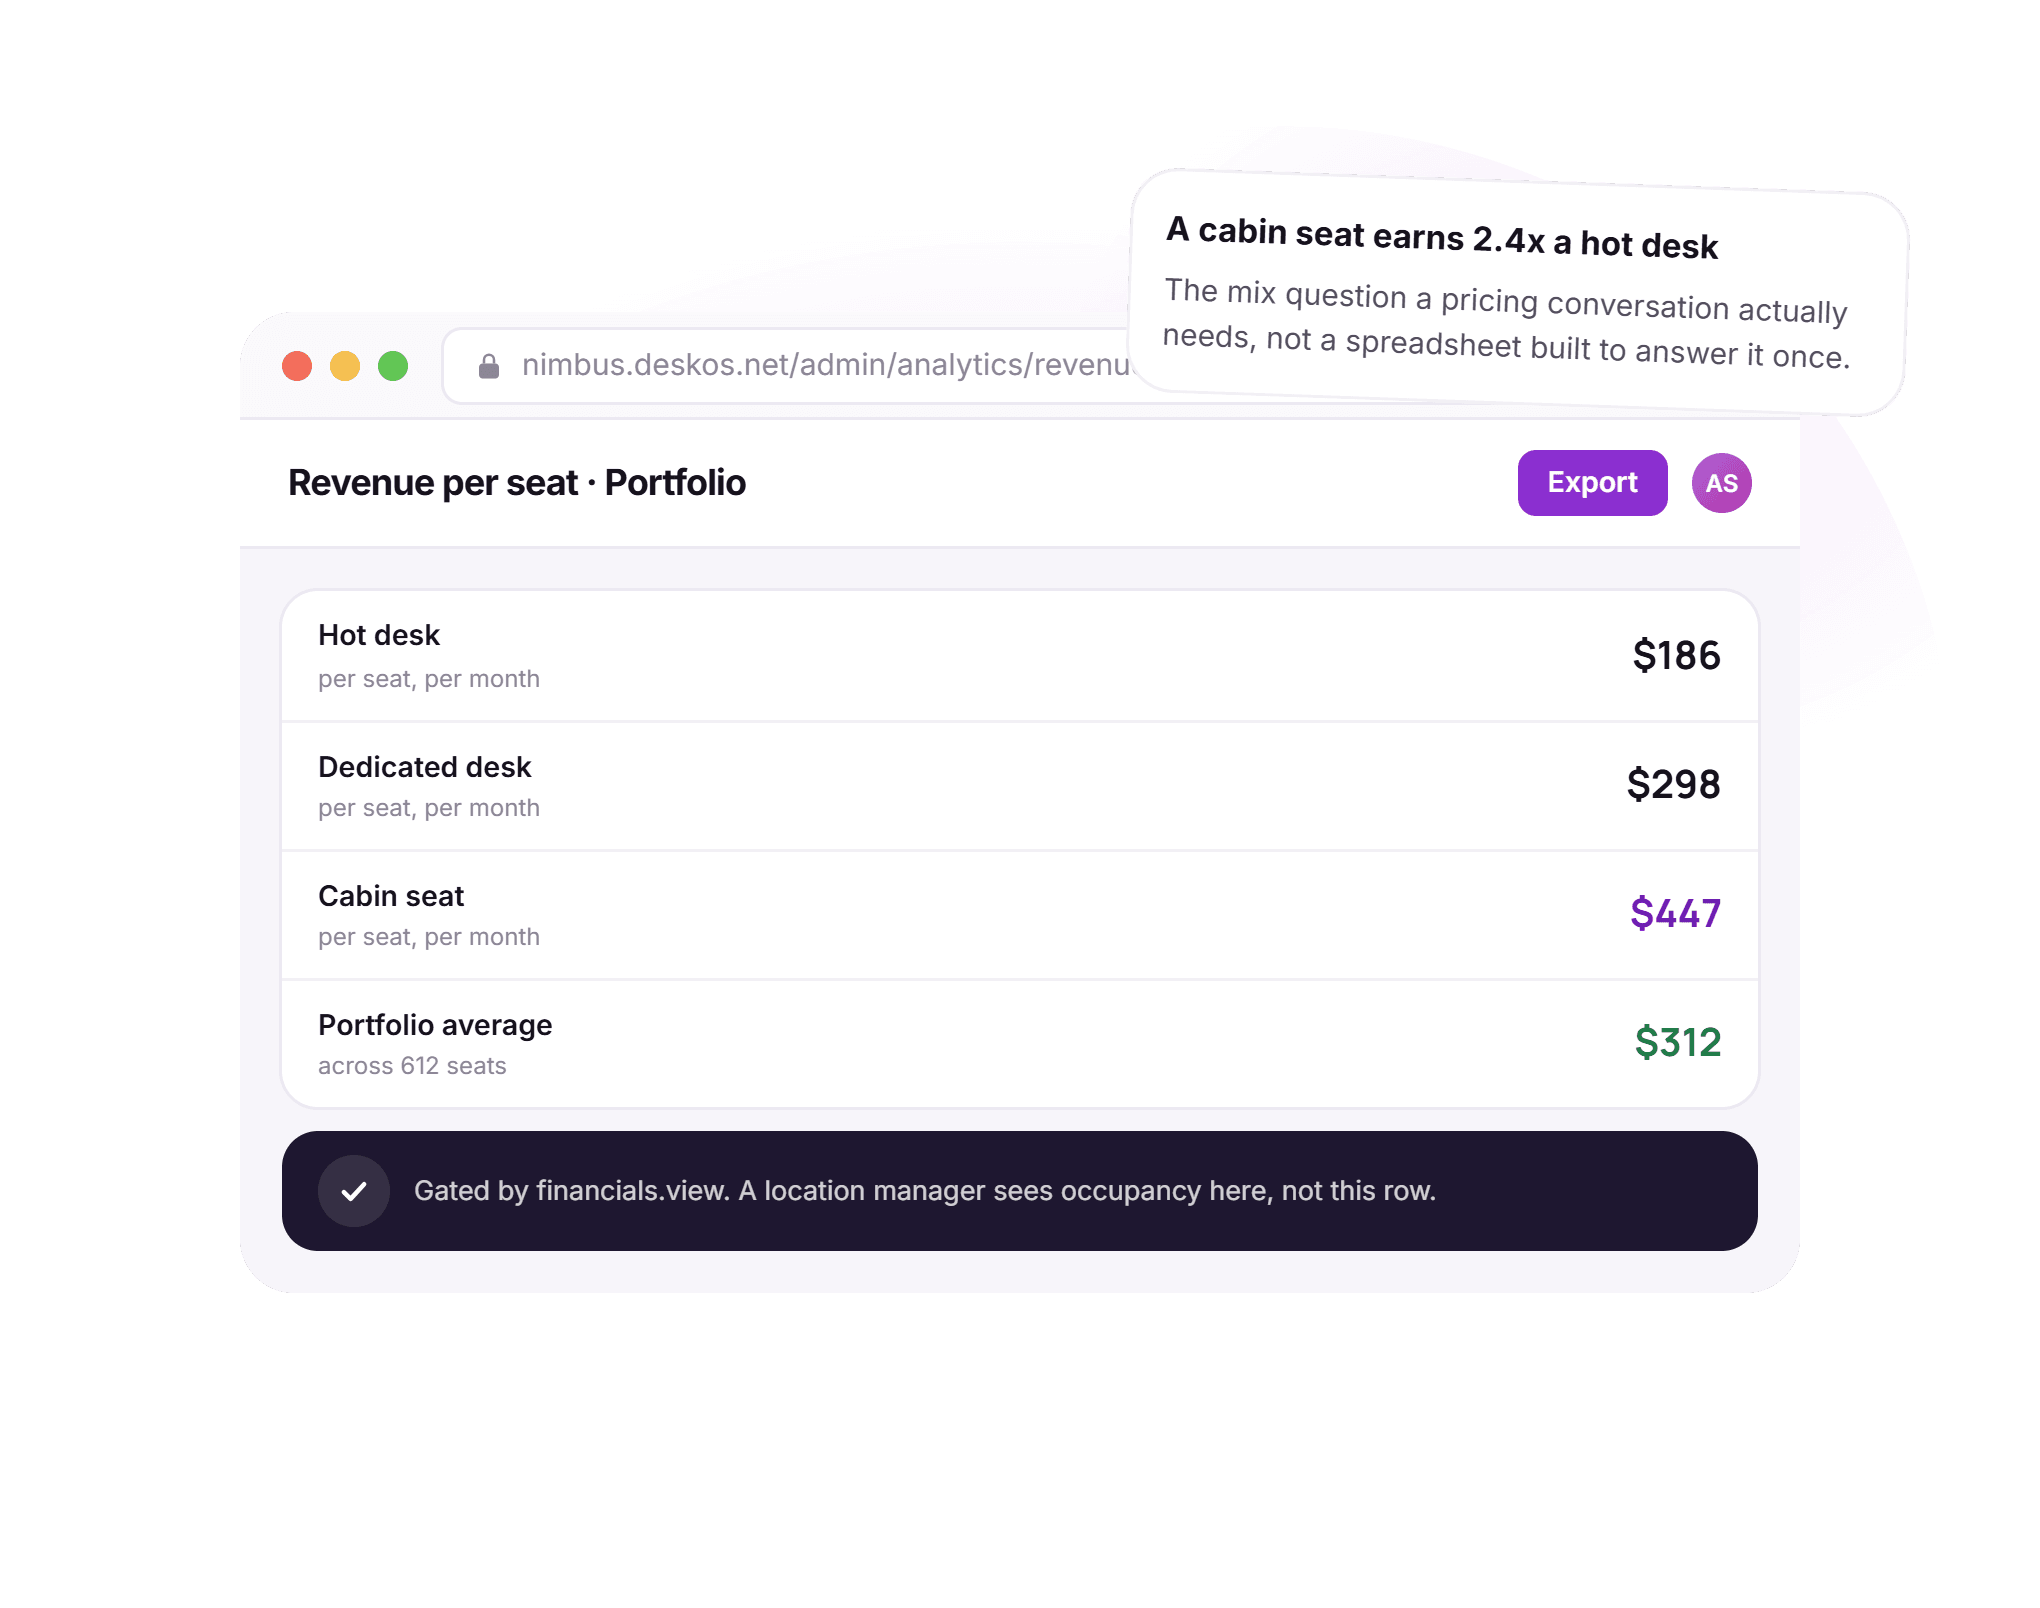
See what each seat actually earns, which plans carry the site and which discounts have quietly become the standard rate. Broken down by location and seat type rather than one blended average.
Where the invoiced figure behind this comes from - Tours41%Proposals28%Agreements19%
Conversion at every stage of the pipeline
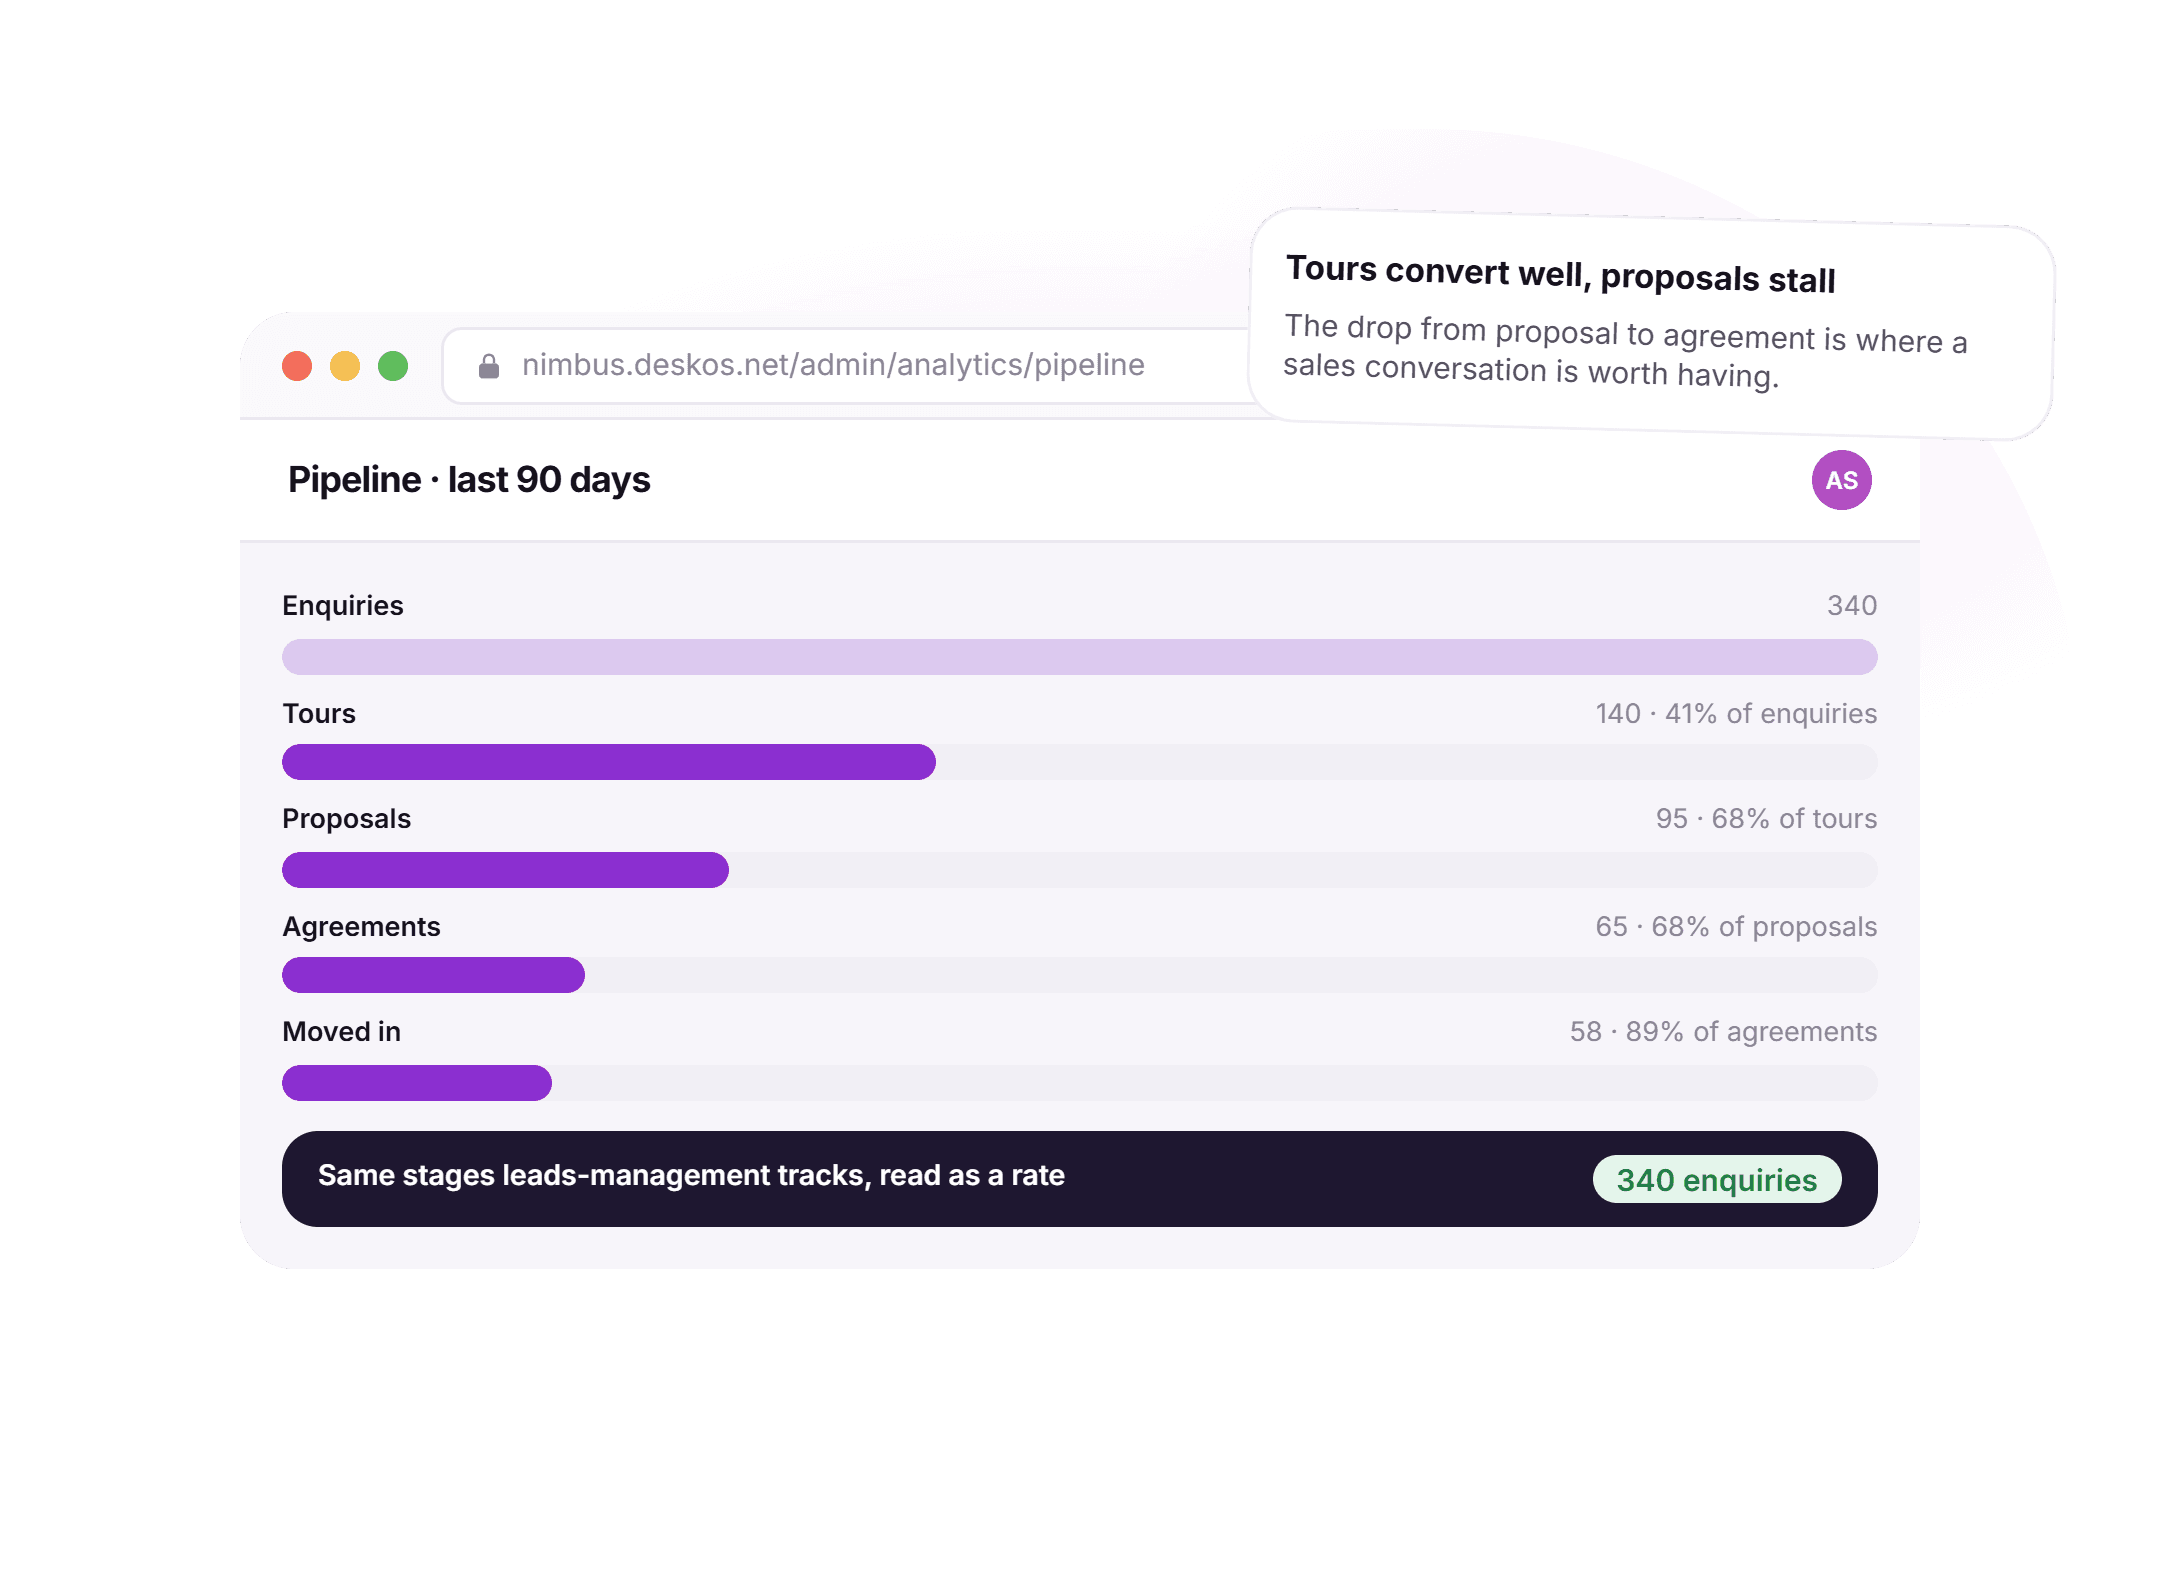
Enquiries, tours, proposals, agreements and moves, with the drop off between each. Every count is clickable through to the leads behind it, so a bad number gets investigated rather than accepted.
- Meridian Labs18 daysNo notice given yetFlagged before the renewal is missed
Churn and notice, early enough to act
Notices given, terms expiring and the seats they release, on a forward calendar rather than a rear view mirror. Renewal risk shows up as a list of accounts to call, not a number at the end of the quarter.
- OccupancyRevenueLocationPlanMonthNo SQL, no export cycle
Build your own view without asking us
A semantic layer over the operational data with the metrics already defined, so your team assembles the report they want from fields they recognise. No SQL and no export cycle.
- Investor viewRead onlyScheduled to an inbox, 1st of each month
Dashboards for the people who ask for numbers
Schedule a view to an inbox, share a dashboard with a landlord or an investor, or give a corporate customer a read only view of their own usage. Financial figures stay behind permissions.
- BillingSpacesLeadsAttendanceSame records that run the business
Not a data warehouse project
The numbers come from the same records that run billing, seating and leads, so there is no pipeline to build and nothing to keep in sync with anything else.
- OccupancyVisibleRevenue per seatGatedfinancials.view, per role
Financials sit behind a permission
Revenue and margin are gated by financials.view. A location manager can see their own occupancy without ever seeing the portfolio revenue line.
- North Park79%38 vacant seats, tap to list themEvery number opens its own rows
Every count drills through
A number on a chart opens the exact rows behind it, which is how you tell a real trend from a data entry mistake, instead of trusting a chart nobody can question.
Thirty minutes with a person, on your own occupancy number.
From the records that run the day to a number your team can trust.
Five things happen on the same data, every day. None of them is a separate project to maintain.
- 1Every night
The numbers rebuild from the same records that ran the day
No export, no spreadsheet somebody rebuilds by hand. Occupancy, invoices and leads are read straight off the tables that already run the business.
- 2Per screen
Occupancy means the same thing everywhere it appears
Reserved plus notice. Soft holds vacant. Applied once, so the live board, the floor plan and the board pack never disagree with each other.
- 3Per role
What a viewer sees depends on their permission, not the report
A location manager opens the same dashboard as a portfolio owner and sees occupancy without the revenue row, because the gate is on the field, not the file.
- 4On a click
A number opens the rows it was built from
North Park at 79% is a figure and a seat list one click apart, so a bad number is investigated instead of repeated in the next meeting.
- 5On your schedule
A view lands in an inbox without anyone building it again
Any saved dashboard can be scheduled to a recipient, or shared read only with a corporate customer, a landlord or an investor.
What used to be a spreadsheet argument, settled by the record itself.
Four things that used to depend on whoever built the report last, and what they look like when the platform answers them. The revenue picture is shown in dollars; DeskOS bills in your currency.
One number, agreed on before the meeting starts.
A board pack used to carry a different occupancy figure than the one the floor manager quoted on a call, because each side counted notice periods and soft holds differently. Here the rule is applied once, so the two numbers cannot drift apart.
- Occupied means reserved plus notice, applied everywhere
- A soft hold counts as vacant until it actually converts
- The live board, the floor plan and this report share one source
- A location manager and a landlord read the same figure
What a seat actually earns, not a blended guess.
A blended revenue-per-seat figure used to hide which plan was actually carrying a location and which discount had quietly become the standard rate. Here the number is broken down by plan and location, and it is gated so a location manager sees occupancy without seeing the portfolio revenue line.
- Broken down by plan and location, not one blended average
- A cabin seat earning 2.4x a hot desk, visible rather than assumed
- Gated by financials.view, per role
- Read straight off the same invoices billing already issued
The stage that is actually losing deals.
A single conversion percentage used to hide exactly where a deal was being lost. Here every stage of the funnel carries its own rate, read off the same leads your sales team already works, so a stalled stage is obvious rather than buried in one blended number.
- Enquiries, tours, proposals, agreements and moves, each with a rate
- The same stages leads-management tracks, read here as a rate
- Tours converting at 41 percent, proposals stalling at 68 percent
- Every count opens the leads behind it
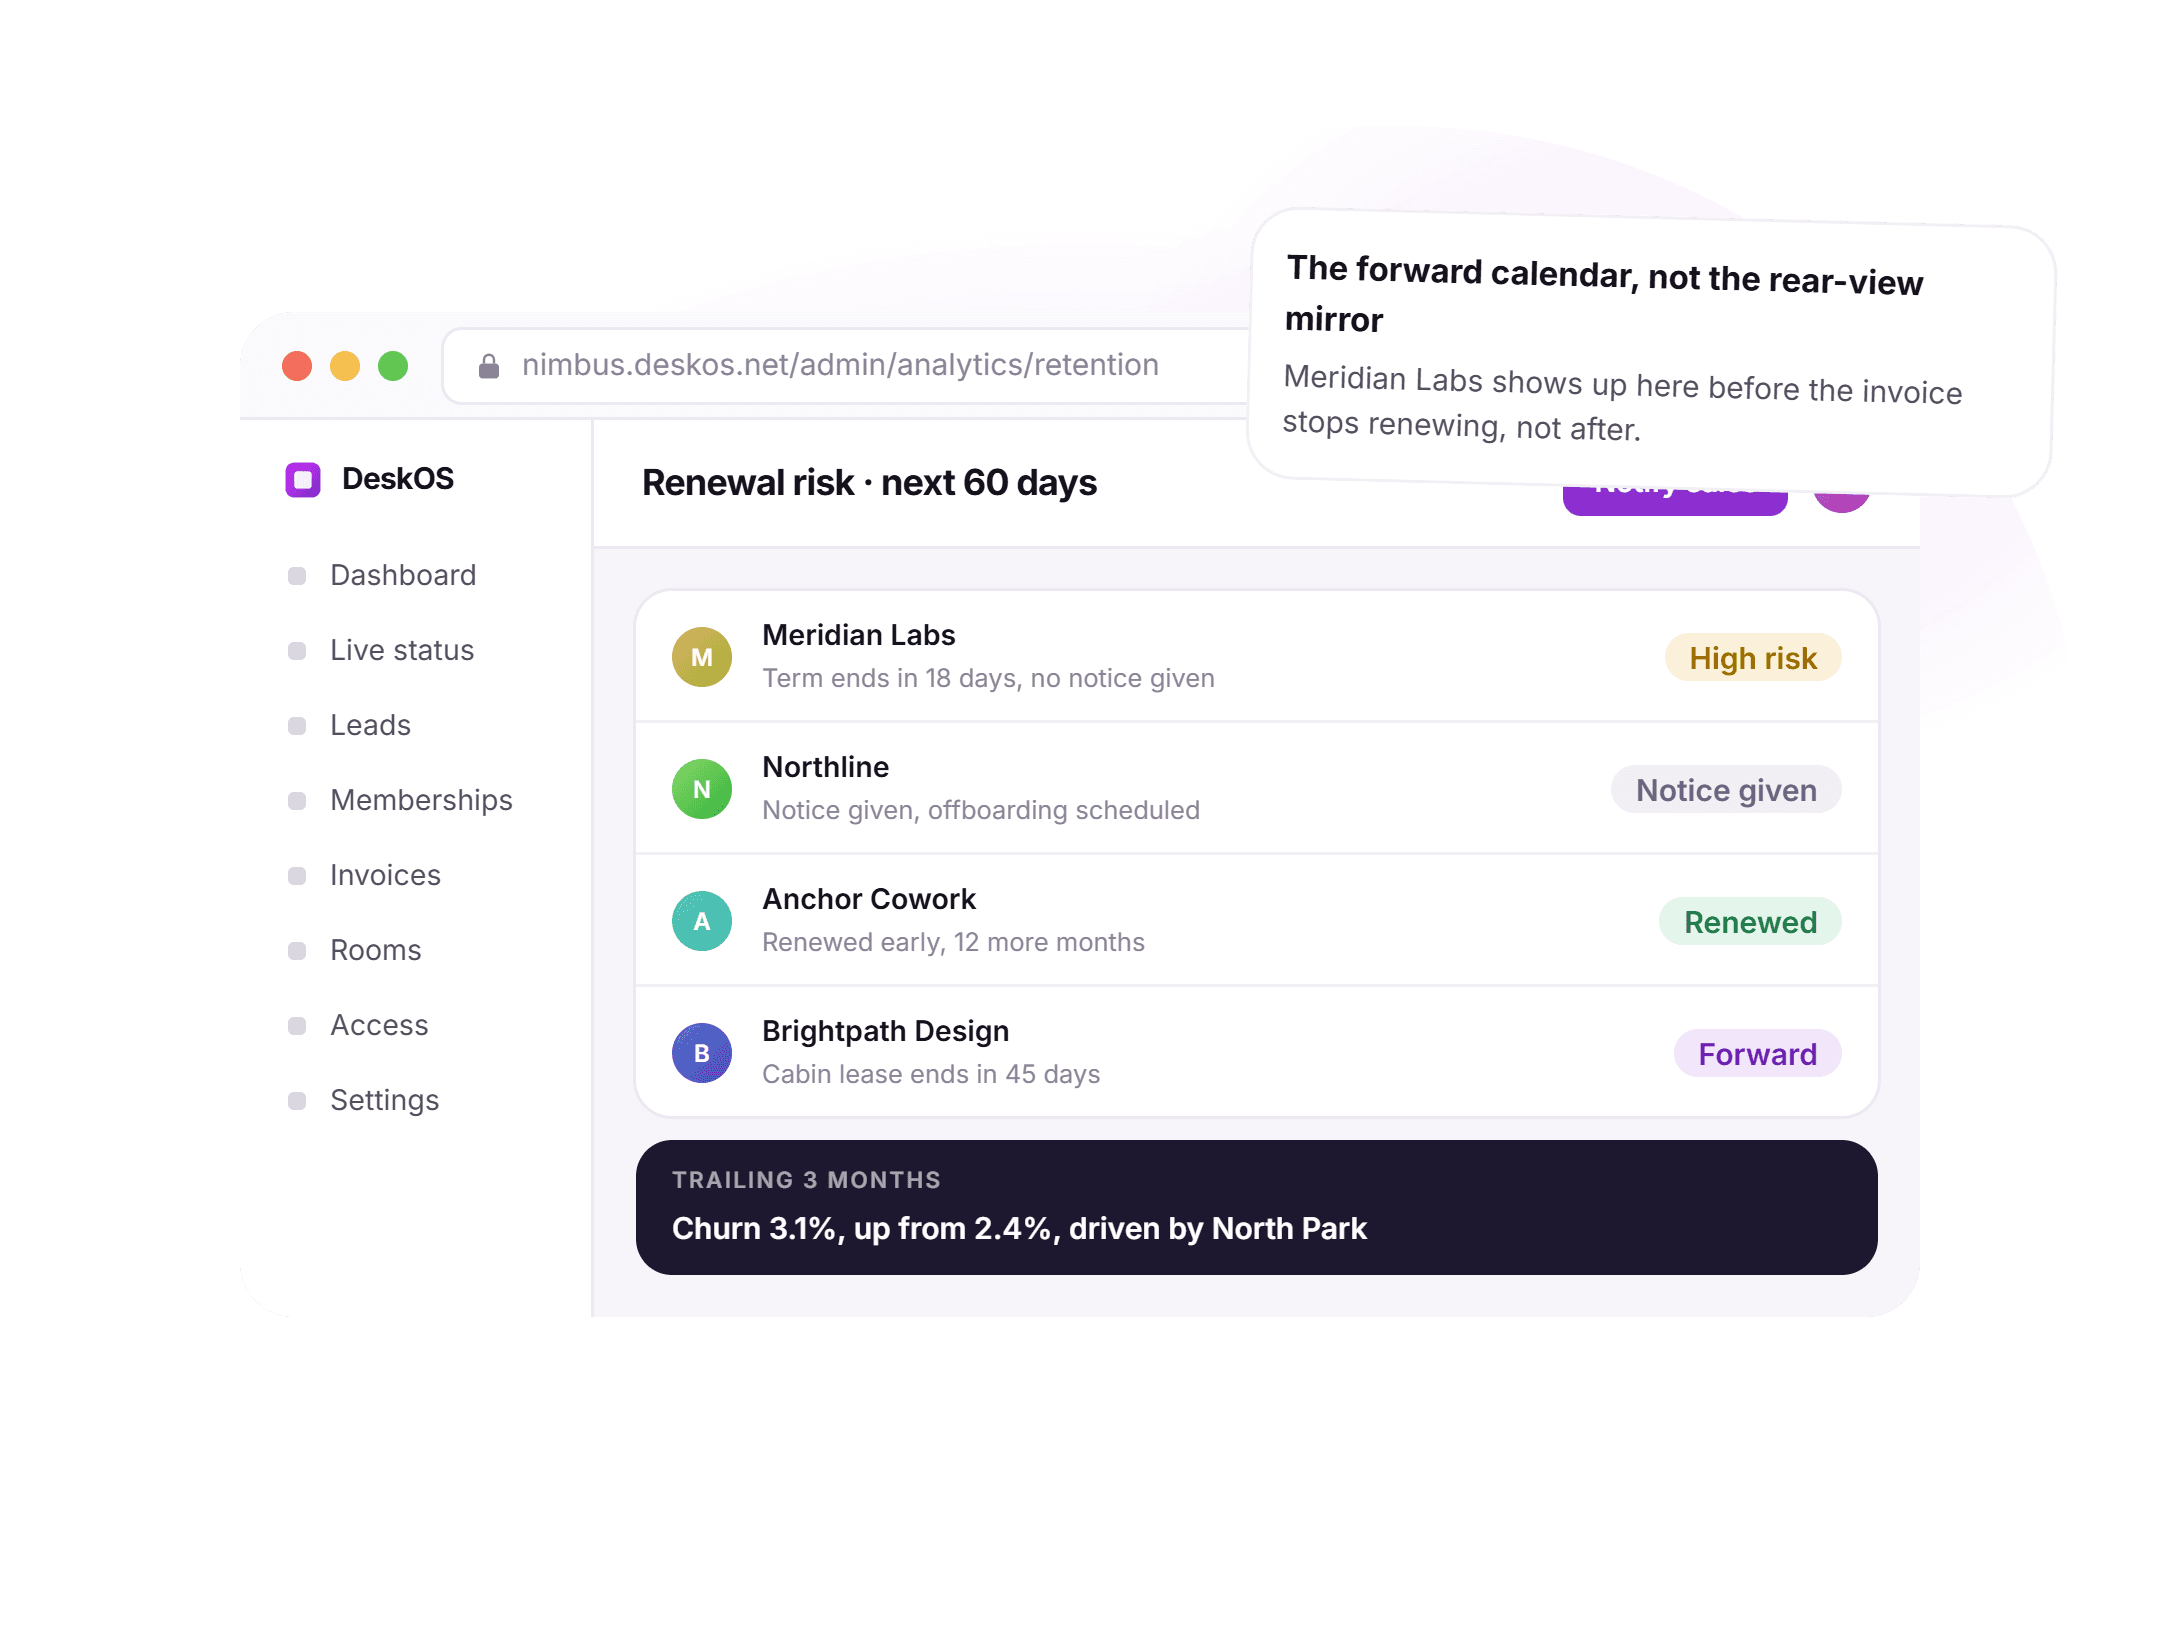
A forward calendar, not a rear view mirror.
Churn used to show up as a number at the end of the quarter, after the accounts were already gone. Here a term expiring without a notice on file shows up while there is still time to call, so a renewal conversation starts before the invoice stops renewing rather than after.
- Every term expiring in the next 60 days, ranked by risk
- A notice already given, shown as exactly that, not a surprise
- Churn trending against the trailing 3 months, with the cause named
- Notify sales straight from the row a risk shows up on
Bring your own month of data. We will build the numbers live.
A report is only as honest as the system it reads from.
Most analytics projects fail on the join between systems. When seats, invoices and leads already share a database, there is nothing to join.
- Occupancy comes off the real seat boardThe 87 percent on a dashboard is the same figure your team would see counting reserved and notice seats on the live floor plan.Space management
- Revenue per seat comes off the real invoicesThe dollar figure on a revenue screen is invoiced and collected, on the same ledger your accounts team already reconciles.Billing and payments
- Pipeline stages match what an agent already worksThe tours and proposals a funnel counts are the same records an agent qualifies and books, so the rate is never a separate tally.AI agents
- A renewal risk can trigger a rule, not just a chartA term expiring without a notice is the same event automation watches for, so a dashboard finding can become an alert.Automation
Everything in analytics.
For the reader who wants the whole feature list on one screen. Every line is something a report does today, on your own data.
Occupancy
- Reserved plus notice counted occupied, everywhere it appears
- Soft holds counted vacant until they actually convert
- Per seat, per location or across the whole portfolio
- The live board, floor plan and this report share one source
- A forward view of seats a notice is about to release
- No second occupancy number to reconcile against
Revenue
- Revenue per seat, per plan, per location
- Portfolio average alongside the mix that built it
- Collections against invoiced, on time and outstanding
- Gated by financials.view, so a role sees only what it should
- Read straight off the same invoices billing already issued
- No blended figure hiding which plan is carrying a site
Pipeline
- Enquiries, tours, proposals, agreements and moves
- A conversion rate at every stage, not one blended number
- Every count clickable through to the leads behind it
- The same stages and stage names leads-management uses
- Time to close, alongside the count at each stage
- A stalled stage visible before the quarter ends, not after
Retention
- Terms expiring in the next 60 days, ranked by risk
- Notices given, logged the moment they arrive
- Churn trending against the trailing 3 months
- Seats a notice is about to release, on a forward calendar
- Notify sales straight from the row a risk shows up on
- A renewal conversation started before the invoice lapses
Builder and sharing
- A semantic layer with the metrics already defined
- Your own view assembled from fields your team recognises
- No SQL and no export cycle to keep in sync
- A dashboard scheduled to an inbox on the cadence you choose
- A read only view for a landlord, investor or corporate customer
- Permission rules carried to whoever the view is shared with
Trust and access
- One occupancy rule applied once, not argued per report
- Every number on a chart opens the rows it was built from
- No pipeline to build and nothing to keep in sync separately
- Financials gated by role, not by which screen you happened to open
- A location manager and a portfolio owner reading one source
- A bad number investigated, because it is never just a chart
Missing a view? Ask. It is usually one field away.

“DeskOS has been really valuable for us. The visibility helps us make better decisions, while the automation has taken a lot of manual work off our plate.”
Sanjeev Laroia, Spacetime · 3,000+ seats across India
700 invoices in a single click
A full month raised in one action, GST worked out per invoice, and every one delivered on WhatsApp and email the same day.
100 leads a day, nobody typing
Enquiries land, get qualified by workflow and are sent an invitation to come and see the space, without anyone opening a sheet.
Meeting rooms stop being your problem
Members book from the app, credits come off automatically, overages land on the next invoice, and the front desk keeps no diary.
What changes when the report reads the same tables the business runs on.
A rebuilt-by-hand spreadsheet and a BI tool bolted onto an export both work, right up to the week the export is late, the definition drifts, or nobody can explain where a number came from. This is what the difference looks like day to day.
- An occupancy number
- A hand-built spreadsheet
- Rebuilt by hand in a spreadsheet, out of date the moment it is sent
- A BI tool on an export
- A BI dashboard reading a stale export nobody trusts
- DeskOS
- One rule, read live off the same seat records the floor uses
- Revenue per seat
- A hand-built spreadsheet
- One blended average that hides which plan carries the site
- A BI tool on an export
- A finance-only export the floor team never sees
- DeskOS
- Broken down by plan and location, gated by role
- A stalled pipeline stage
- A hand-built spreadsheet
- Buried inside one conversion percentage for the whole funnel
- A BI tool on an export
- Noticed only if someone happens to open the CRM
- DeskOS
- A rate at every stage, each count opening its own leads
- A renewal at risk
- A hand-built spreadsheet
- Discovered when the account stops paying, not before
- A BI tool on an export
- A calendar reminder someone has to set themselves
- DeskOS
- Surfaced 60 days out, ranked by risk, before the term lapses
- A new report your team wants
- A hand-built spreadsheet
- An email to a data team and a wait for the next sprint
- A BI tool on an export
- An export into a BI tool somebody has to keep wiring up
- DeskOS
- Assembled from defined fields in minutes, no SQL
- A number a customer asks about
- A hand-built spreadsheet
- A manually built spreadsheet emailed on request
- A BI tool on an export
- No safe way to give an outsider a live view at all
- DeskOS
- A read only dashboard, scoped and shared in a click
Bring the number nobody trusts. We will show you where it actually comes from.
Simple plans. No per module add-ons.
Basic starts at $59 a month billed yearly, excluding VAT or GST. Every plan includes every module. You pay for seats and locations, nothing else.
Basic
For smaller spaces streamlining operations and getting billing under control.
$59 / month
billed yearly
- Active seats
- Up to 100
- Locations
- 1
Includes
- Space management and utilisation
- Meeting room management
- Billing with automated invoicing
- Helpdesk and service requests
- Web based access for the team
- Most taken
Business
Growing spaces building a community and premiumising what they sell.
Quoted on request
Scoped to your seats and locations
- Active seats
- Up to 200
- Locations
- 2
Everything in Basic, plus
- Visitor management
- Daily check-in management
- Community management
- Leads management CRM
- Payment gateway, receipts and credit notes
- Dedicated relationship manager
Business+
Bigger spaces that want their own apps and their own brand in front of members.
Quoted on request
Scoped to your seats and locations
- Active seats
- Up to 600
- Locations
- 3
Everything in Business, plus
- Whitelabel Android and iOS apps
- Lease management
- Client attendance tracking
- Cafe management
- Advanced reports
- Priority support, 24x7
Running more than three locations or 600 seats? That is Enterprise, quoted once we know your portfolio.
Still tied into another platform? We will buy out your contract. Ask us on the call.
Your own numbers, tested by us first.
Before you point a dashboard at your whole team, we build your real occupancy and revenue figures against one location and a month of data, so you can see exactly where they come from. The person who builds the view is the person who answers when you call.
What happens next
- 1
Give us one location and a month of data
Fill in the form or message us on WhatsApp with the location you want to start with. We build your real occupancy and revenue numbers against it, not a demo dataset.
- 2
We show you the number before you decide anything
Your own seats, invoices and leads, in a sandbox, so you can see your real revenue per seat and where your pipeline actually stalls.
- 3
Turn on the views your team actually asked for
Start with the dashboards that replace the reports someone rebuilds by hand today, then add the ones your team discovers it wants once the data is live.
Questions operators ask about analytics.
Do we need to connect a BI tool?
No. Analytics is part of the platform and reads the same records that run seating, billing and leads. If your finance team prefers their own BI tool, the data can be exported, but nothing here depends on it.
How do you define occupancy?
Occupied is reserved seats plus seats under notice. Soft holds count as vacant until they convert. That definition is applied consistently across every screen and report, which is the point.
Can we compare locations?
Yes. Every view can be run per location or across the portfolio, so you can see which site is carrying the group and which one is quietly under performing.
Can our customers see their own numbers?
Yes. A corporate account can be given a read only dashboard of their own usage, attendance and bookings, which is usually what they were emailing your team for anyway.
Can we schedule a report to arrive every Monday?
Yes. Any saved view can be scheduled to an inbox on the cadence you choose, with the same permission rules applied to the recipient.
Who can see revenue and margin?
Whoever holds the financials.view permission. A location manager can see their own occupancy and pipeline without ever seeing the portfolio revenue line, and that gate is enforced on the field, not by hiding a whole screen.
What happens when a number looks wrong?
Click it. Every count on a chart opens the exact rows it was built from, so you can tell a real trend from a data entry mistake instead of arguing about a chart nobody can question.
Can we build a view that is not one of the defaults?
Yes. The metrics sit on a semantic layer with the fields already defined, so your team assembles the report it wants without SQL or a request to us.
Does this replace the leads or billing dashboards inside those modules?
It sits alongside them. Leads and billing show you the operational detail for that team; analytics is the portfolio view across all of it, built from the same underlying records so the numbers never disagree.
How fresh is the data?
Live. There is no overnight export or a warehouse copy running a day behind, because the report reads the same tables the rest of the platform writes to.
The rest of the system this plugs into.
- Space managementSeats, floors and live occupancyOccupancy on a dashboard is the same figure the live seat board shows.Space management
- Billing and paymentsInvoices, tax, gateways and collectionsRevenue per seat is read off the same invoices your accounts team reconciles.Billing and payments
- Attendance and check-insWho is in, on which day and shiftSeats sold against seats actually used is the number behind every layout decision.Attendance and check-ins
- AutomationReminders, workflows and outreachA renewal risk on a dashboard can trigger the same rule automation runs.Automation
Send us a month of real data. Watch the numbers build live.
We will build your own occupancy, revenue and pipeline numbers against one location, and show you exactly which records each figure came from. It takes about ten minutes.